Tips for centralized logging infrastructure with logstash

Note
This article was originally written in 2014. Since that time logging with open source software ecosystem has evolved substantially. To reflect those changes, I have added an "Update 2019" section at the end, leaving original content unchangedPreface
ELK - Logstash, Elasticsearch and Kibana is becoming more and more commonly used software solution for centralized logging. It is relatively easy to setup. This article provides some tips on logstash configuration, which can improve quality and results from this wonderful software stack.
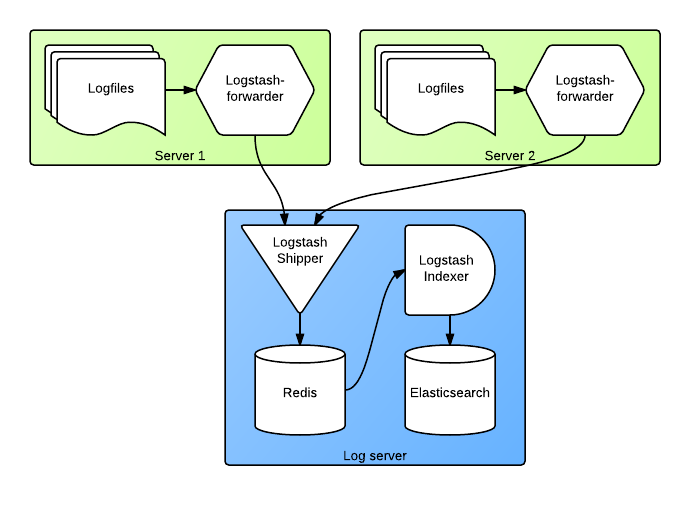
Logstash is very flexible data processing tool. It allows various setups, from very small to complicated and scalable solutions. I'm presenting in this article a medium-scale setup, which is able to collect data from one to a few hundered of typical web or application servers. The following diagram shows system elements:
Forwarding logs using logstash-forwarder
Logstash-forwarder (formerly known as lumberjack) is a component, which collect logs from machines and ships them to central logstash instance. It should be installed on every server which saves any kind of logs. It works by opening all specified log files and doing a "tail" operation on them. It is watching the files for new contents and forwarding incoming entries to the specified logstash server. As logfiles contain information which should be kept secret, it uses TLS encryption for data transmitted over public networks (aka Internet). It works great with logrotate - when log files are rotated (what is always good idea), it starts reading the new file from beginning. Let's have a look on sample configuration file:
{
    "network": {
                "servers": [ "logging.domain.xxx:5043" ],
                "ssl ca": "/etc/ssl/certs/logstash-forwarder.crt",
                "ssl certificate": "/etc/ssl/certs/logstash-forwarder.crt",
                "ssl key": "/etc/ssl/private/logstash-forwarder.key"
    },

    "files": [
                {
                    "paths": [ "/home/app/current/logs/*.log" ],
                    "fields": { "environment": "production", "type": "rails"  }
                },
                {
                    "paths": [ "/var/log/syslog", "/var/log/*.log" ],
                    "fields": { "environment": "production", "type": "syslog"  }
                }
    ]
}
In the example above, we have specified some system and application logs that should be forwarded. What we also did - we have specified additional fields, that will be appended to each log message. Internally, each log is a JSON object which contains some standard fields (like hostname, timestamp, file name, message). Using additinal fields allows us to "tag" each message. It is pretty helpful later, while browsing / searching logs. Kibana offers very nice interface to elasticsearch facets. Thanks to tags, we can easily filter out interesting messages - for example, see only rails application logs, or only logs from specific environment (production, staging, etc.). Useful tags can be:
- Environment
- Datacenter (if we use more than one), provider or server / rack location
- Application name (if we run several applications)
- Cluster name
Logstash server
Logstash is very easy software. It contains three components - and three corresponding sections in the configuration file:
- Input - source of data
- Filters for transforming messages
- Output - one or multiple destination for our logfiles
For achieving stable and robust infrastructure, it's pretty good approach to have two logstash instances on logging server. This setup allows you to perform maintenace tasks (like restarting services) and still minimizing the period, where log receiver is down. As restarting Elasticsearch with hundreds of giabytes of data can take several minutes, it's definitely an option worth considering.
logstash-shipper
The first logstash instance, shipper, is supposed to get log messages from our servers and save it somewhere, prefferably very fast. At this instance we should focus on quick recieving log messages, not on transforming them. Therefore the usual input is lumberjack, filters should be empty - or contains only rules to reject some unwanted messages, output is a queue (like RabbitMQ / ActiveMQ) or redis (which internally uses list data structure). Redis is very easy to setup and offers great performance (as it is operating in memory). In that case it's good practice to limit redis list size to avoid filling up memory. Example configuration of shipper:
input {
  lumberjack {
    port => 5043
    type => "logs"
    ssl_certificate => "/etc/ssl/certs/logstash-forwarder.crt"
    ssl_key => "/etc/ssl/private/logstash-forwarder.key"
  }
}

output {
  redis {
    host => "localhost"
    data_type => "list"
    key => "logstash"
    congestion_interval => 1
    congestion_threshold => 20000000
    workers => 16
    # Batch processing requires redis >= 2.4.0
    batch => true
    batch_events => 50
    batch_timeout => 5
  }
}
In the above configuration we specified congestion_threshold - which is maximal allowed size of list holding unprocessed log messages. In typical cases this list should remain empty or contain very little entries. If, however, for some reason we're getting logs faster than we process them (or if we don't process them, because of problems with shipper), then the list will start to occupy our memory. If the congestion threshold is reached, logstash-shipper will stop accepting new messages from clients. This is safe situation - logstash-forwarder instances will know which log entries have been succesfully tansported, which not - the log shipping will continue from this point when shipper is again available. No log entries will be lost.
logstash-indexer
The second logstash instance, indexer, is getting log messages from queue (in our case, list in redis), process them and save in several stores. Documentation suggests using Elasticsearch as storage backend. This is definitely good option. However, at some time we might run out of disk space. In production environments we usually save log messages in two places - elasticsearch and files. The first store should contain only last XX days of logs, files should contain full archive. To be able to scale the files storage, we can either manually move them to cheap, scalable storage (like Amazon Glacier, S3, Rackspace CloudFiles) or save them directly in some distributed filesystem (like GlusterFS or Hadoop HDFS). For HDFS we can use a seperate logstash output plugin, for others - just save on filesystem. It's also good idea to compress the logs (for example via cronjob). One of our logstash-indexer configs looks like this:
input {
  redis {
    host => "localhost"
    data_type => "list"
    key => "logstash"
    threads => 2
    batch_count => 1000
  }
}

filter {
  ### Break syslog-like message into fields
  if [type] in [ "syslog", chef" ] {
    grok {
      overwrite => "message"
      match => {
        "message" => "^(?:<%{POSINT:syslog_pri}>)?%{SYSLOGTIMESTAMP:syslog_timestamp} %{IPORHOST} (?:%{PROG:program}(?:\[%{POSINT:pid}\])?: )?%{GREEDYDATA:message}"
      }
    }
    syslog_pri { }
    date {
      match => [ "syslog_timestamp", "MMM  d HH:mm:ss", "MMM dd HH:mm:ss" ]
      timezone => "Europe/Berlin"
    }
  }

  ### JSON messages - decode + tag
  if [type] in [ "performance_check", "performance_monitor" ] {
    json {
      source => "message"
      add_tag => ["performance"]
    }
    date {
      match => [ "timestamp", "UNIX" ]
    }
  } else {
  ### Log messages - tag
    mutate {
      add_tag => ["logs"]
    }
  }
}

output {
  elasticsearch {
    host => "127.0.0.1"
    manage_template => true
    workers => 1
    flush_size => 2000
    idle_flush_time => 5
    index => "logstash-%{+YYYY.MM.dd}"
    tags => ["logs"]
  }

  elasticsearch {
    host => "127.0.0.1"
    manage_template => true
    workers => 1
    flush_size => 2000
    idle_flush_time => 30
    index => "performance-%{+YYYY.MM.dd}"
    tags => ["performance"]
  }

  ### HDFS archiver
  hdfs {
    path => "/user/logstash/performance-%{+YYYY.MM.dd_HH}.json"
    hdfs_location => "hdfs://master01.data.gears.xxx:8020"
    hadoop_config_resources => ['/etc/hadoop/conf/core-site.xml']
    enable_append => true
    dfs_replication => 2
  }
}
The example above does following:
- Get messages from redis running on localhost
- Break syslog messages into fields, using grok regular expression engine
- Tag performance logs and system logs
- Save performance and system logs in seperate Elasticsearch indices
- Archive logs in Hadoop filesystem
The Elasticsearch indexes have date included in their name. It makes it easy to implement a cronjob, which deletes indexes older than XXX days. Performance and system logs are also seperated between two indexes, which makes it easier to deal with different types of data with Kibana. Finally, we save our logs in HDFS. Why this datastore? It's easy to setup component of Apache Hadoop. You don't need to be Hadoop expert to be able to benefit from its components - and in our case, use scalable, distributed and replicating filesystem.
Notes on hosting
While more and more projects benefit from IaaS hosting and public cloud offerings, in many cases for log storage we don't need cloud flexibility - but we need cheap storage. It's usually cheaper and better to forward logs from services hosted in clouds to dedicated machines. You can have plenty of storage and flexible contracts by using servers from companies like Hetzner, Leaseweb or OVH. Lumberjack protocol (used internally by logstash-forwarder) uses TLS for authentication and encryption, which will help you to encrypt log messages and make sure, that no one else can flood your log storage and disk space problems.
Update 2019
As the article above seems to still get some visits, I decided to post below a short update, as the Elastic stack has evolved over last years and some parts are worth updating:
filebeat
Logstash shipper is not active as a project anymore. Elastic stack now includes a family of components, called beats. filebeat should be used for shipping log files. It can ship to logstash instance, into the intermediate queue (redis or kafka) or directly into elasticsearch (with an option to configure Elasticsearch ingest pipeline). Filebeat also offers additional functionality and can setup Elasticsearch mappings, ingest pipelines and Kibana dashboards automatically.
Alternatively, fluentd can be used to ship logs into centralized logging system. While we don't use it at KoreKontrol, it might be considered as a replacement, for example if parts of your architecture already use it.
Elasticsearch pipelines
Elasticsearch has now feature called ingest pipelines. It can be used to analyse incoming data - for example, work with json objects, perform grok-based operations on strings or add/remove/change fields. Those operations, when applied to big volume of incoming logs, could be the "heavy lifting". Executing those in Elasticsearch cluster (instead of logstash instance) allows distributing load over cluster nodes, which is very handy in terms of availability and scalability.
Queue store
The article above suggests using Redis for queue of processing. While it offers great flexibility, its capacity is limited by available memory. It has happened during long maintenance periods or downtimes, that redis fills up all available memory and stops accepting new messages. To overcome this problem, a disk-based redis alternative (like ardb) or another queue broker (like RabbitMQ or Kafka, which allow clustered operations as well) can be used.
High availability and scaling out
It is possible (and recommended) to setup logstash in clusters. This allows scaling out by adding additional instances of Logstash as well as it removes single point of failure from the system. It does not require additional load balancers, as filebeat can be configured to send output to multiple logstash destinations. For high-availability of queue stores, we recommend using RabbitMQ or Kafka